

Central to the Regional Cabled Array (RCA) Quality Assurance/Quality Control (QA/QC) workflow is a cloud-based data harvest and visualization platform that allows for efficient and timely review of the high-frequency and high-density time series data streaming from RCA instruments. A key component of this workflow is a Zarr-based version of the OOI RCA data, a cloud optimized file format that stores metadata separately, allowing data chunks to be retrieved without loading the entire dataset. Using Zarr files and Amazon Web Services (AWS) cloud computing resources for QA/QC has made it possible to create a dashboard that is refreshed daily for multiple high-density datasets and parameters. This also results in minimization of both costs and OOI-Cyberinfrastructure load by appending only new data daily, with a full dataset refresh occurring only when necessary. Because the Zarr files contain time-series data records that include all variables served through M2M (Machine to Machine Learning), this workflow also allows for the efficient deep data review that is currently required for compiling and reviewing QARTOD (Quality Assurance/Quality Control for Real-Time Oceanographic Data) data flag tables.
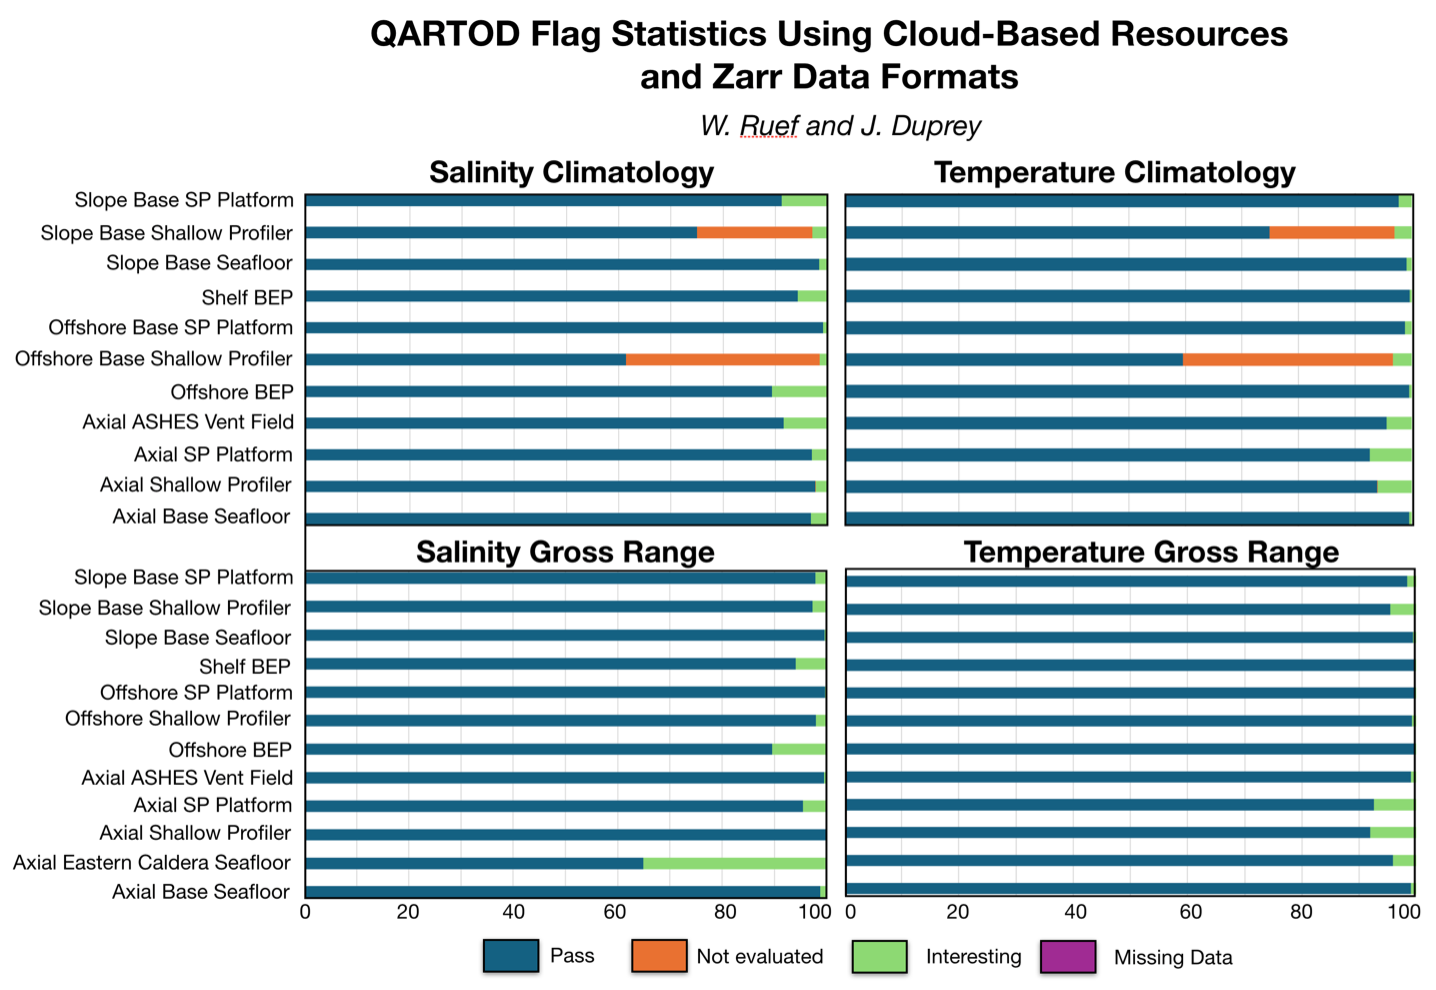
With the existing Zarr files, we were able to quickly access all active QARTOD flags in the RCA data streams for gross range and climatology and produce basic summary statistics for each parameter using minimal AWS cloud and data team resources. The figures above include the results from CTD (Conductivity, Depth, and Temperature) streams across the RCA for temperature and salinity, for both gross range and climatology QARTOD tests. In this initial compilation over 90% of all data points pass the gross range tests for temperature, and all except 2 pass gross range tests for salinity. Similar results were seen with the climatology tests, with nearly all streams having less than 10% of data points flagged as “suspect or interesting”. Most of the flags for non-passing data points in the climatology results were values of “not evaluated” in the Offshore and Slope Base Shallow Profiler streams. Our first set of investigations will focus on these streams to identify the cause for these flags. A suspected cause may be that the isoclines in the water column are not being accurately represented in the climatology depth bins.